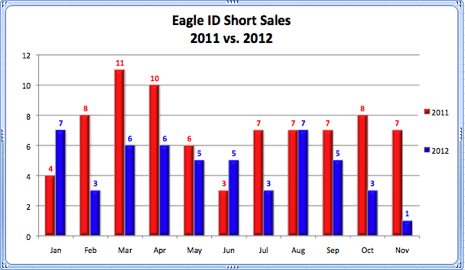
Eagle ID short sales hit their lowest point this year during the month of November. In fact, there was only one. Still, monthly short sales in Eagle ID have typically ranged between 3 and 7 this year. There’s also been a drop in short sales from one year ago. And, while the chart below shows that a few months in 2012 actually posted higher numbers, the overall average for Eagle ID short sales per month this year has been 4.6. In 2011 there was an average of 6.8 short sales each month (Dec. ’11 numbers included.)

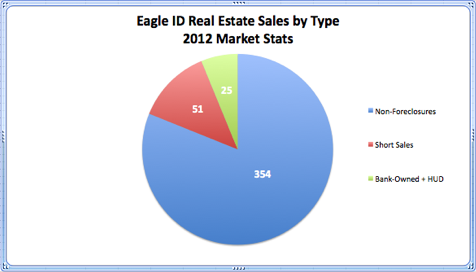
While the foreclosure rate remained low in November (9.7%), Eagle ID short sales have been the more dominant type of distressed sale this year. In the past 11 months, there have only been 25 Eagle bank-owned homes sold. Short sales more than double that number this year. Still, when comparing foreclosure rates year-over-year, the numbers are drastically different. Last year, the foreclosure market share for November was 46.2%, making it 36.5% higher than Nov. 2012 numbers.

While the numbers are negligible, most of the Eagle ID short sales this year were in the Brookwood subdivision. There has been a total of 7. Banbury Meadows, which has the second highest amount, has posted 5 short sales. The short sale in Eagle ID from November was in the Lexington subdivision. Lexington subdivision has now had 4 this year, making it the third highest total for short sales in a given subdivision.

