Deprecated: preg_replace(): Passing null to parameter #3 ($subject) of type array|string is deprecated in /home1/boissto7/public_html/eagleidahoshortsales.com/wp-includes/formatting.php on line 5420

Short Sales Drop to 1.9% in Eagle | May 2014

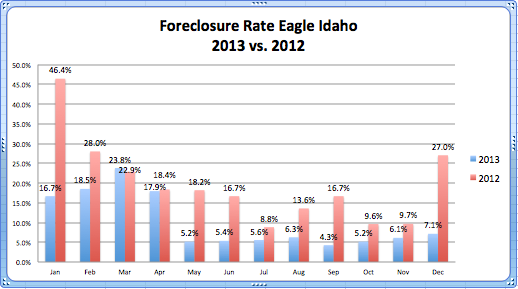
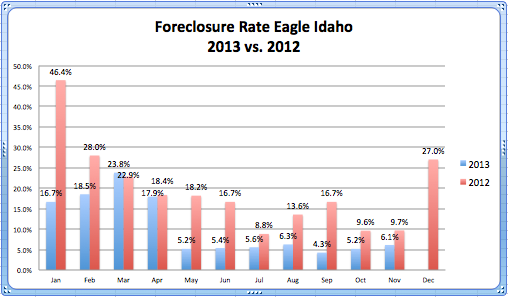
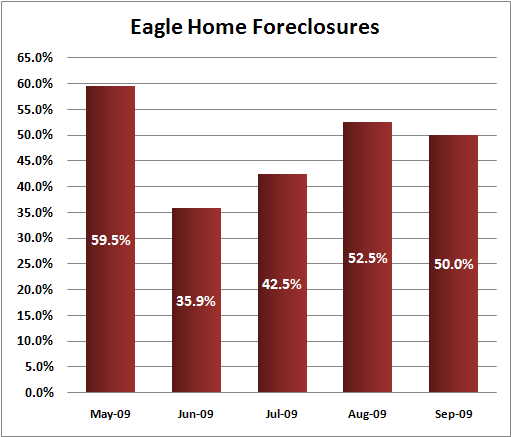
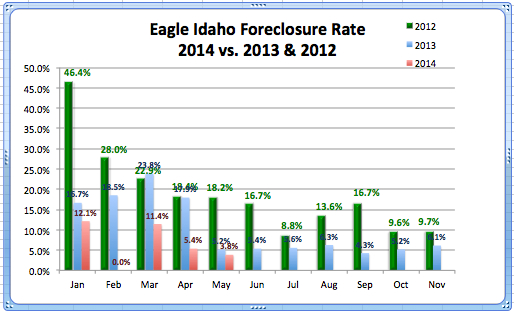
The foreclosure rate in Eagle has stayed below 12% this year, however in February it hit a historical low of 0% of all real estate sales, and in May of 2014 it hit another low of 3.8%. You can see from the graph below that last May the foreclosure rate was only a couple percentage points higher, yet it was 14% higher in 2012. The foreclosure rate is the lowest in Eagle among all Ada County cities, nonetheless we’ve seen a decline everywhere in the county.

The foreclosure rate has dropped 42% since the beginning of 2012, reflecting the continued health of the market and economy.

Eagle Foreclosures '12 - May '14

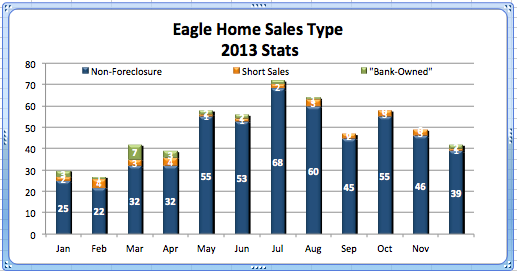
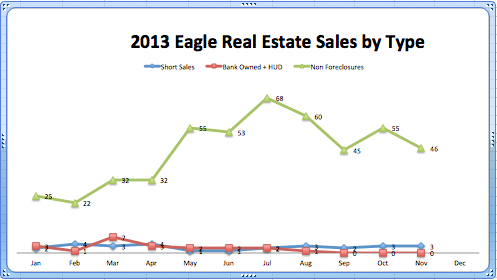
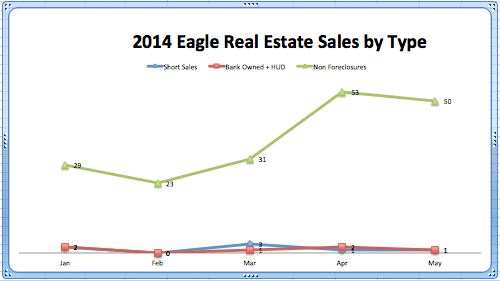
There was one short sale sold in Eagle, May of 2014 along with one bank-owned/HUD  home sale,while there were 50 traditional home sales. This means that the total 3.8% foreclosure rate means only a 1.9% were short sales. May of 2013 also had the same number of short sales in Eagle, yet a higher bank-owned/HUD home sales rate.

These consistencies and slight increases really reflect a stable market that has recovered from massive foreclosure rates throughout the country.

Eagle Real Estate Sales by Type Jan - May '14

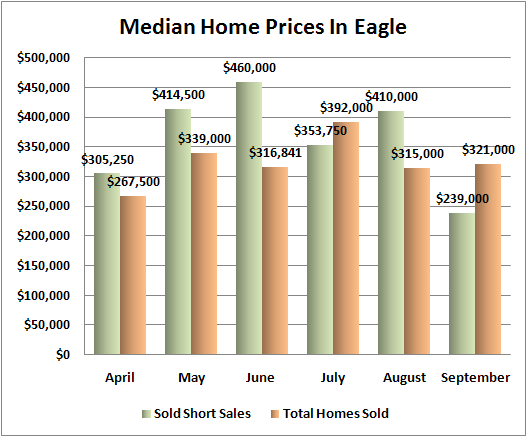
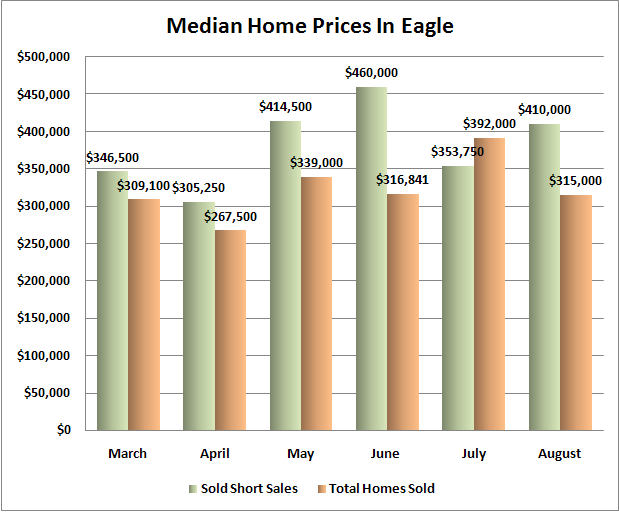
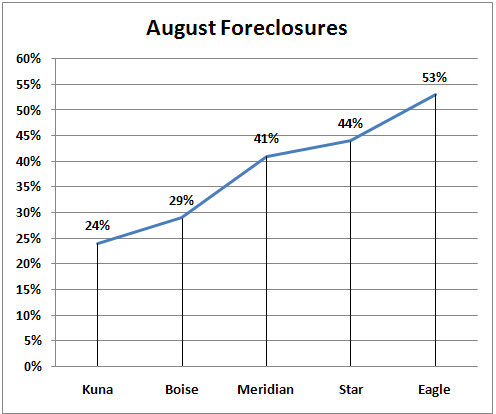
Not only were short sales the same in May ’13 but you can see below that the median home sales price in Meridian is slightly higher than last May of 2013 at $335,000. From April to May of this year the median home sales price increased by 23%.

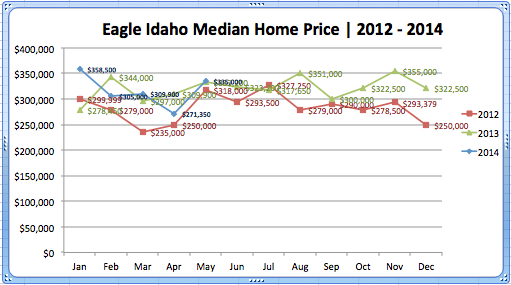
Eagle’s median home sales price was $358,500 the start of the year, 28% higher that the median home sales price January of last year (in 2013). The median always fluctuates month to month however that is a notable increase. The median has since cooled off a bit averaging out to almost the same exact median home sales price between January and May of last year, increasing slightly by only 1%.

Eagle Median '12- May '14

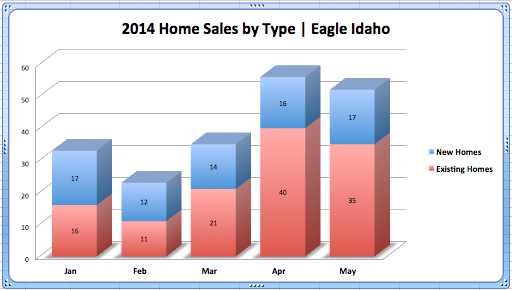
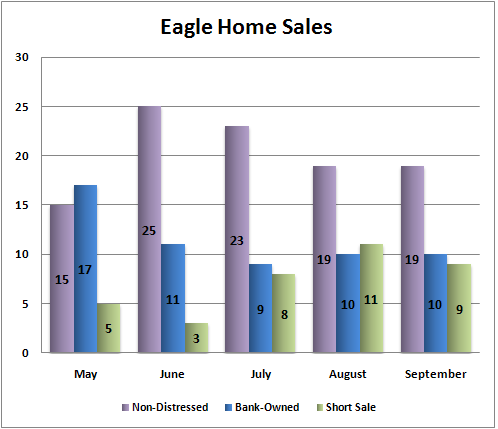
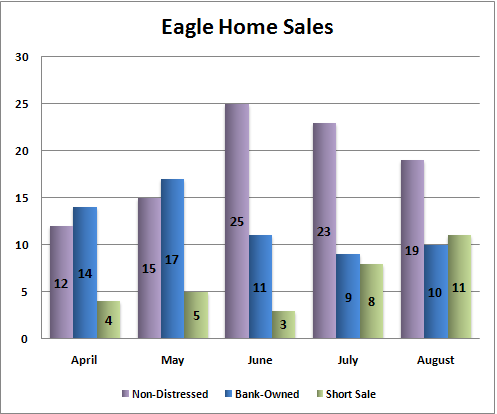
Along with a very similar median home sales price (so far this year compared to 2013) and low short sale numbers- reflecting last years data, new construction sales are pretty close as well. In May of 2014 there were 17 new home sales and last May in ’13 there were 18.

New home sales have stayed very consistent in Eagle this year as you can see in the graph below, while traditional/existing home sales have increased over the months. Traditional home sales have increased by 118% since the start of the year, while new home sales have stayed pretty consistent.

Eagle Home Sales New vs. Existing Jan - May '14

Disclaimer

Eagle Short Sales Hit a Low in 2013

Eagle Short Sales '11-'13

Short Sales in Eagle, 2013 have dropped to a low; the lowest among Ada County cities. As you can see in the graph above, in December of 2013 there was only one short sale in all of Eagle, a 33% drop from 2012, and an 83% drop from 2011. Short sales started off low this year and ended even lower with slight changes throughout the year, all under 5 sales per month. In 2011 there were an average of 7 short sales per month, 2012 4.8, and in 2013 it dropped to 2.4 per month. In total there were 29 short sales in 2013, about half as many sold in 2012 at 58.

As you can see in the graph below, the foreclosure rate in Eagle ended in 2013 at 7.1% of home sales. It decreased by about 20% from December of 2012; a 27% foreclosure rate one year prior. The foreclosure rate in 2012 started at 46.4% and dropped drastically to 8.8% in July of last year. There were highs and lows throughout the rest of the year, but in 2013 the foreclosure rate hasn’t peaked above 7.1% in 8 months. Between the beginning of 2012 and the ending of 2013 the foreclosure rate dropped by 39%. This is a reflection of the quick real estate recovery we saw in 2013.

Eagle Foreclosure Rate '12 vs.'13

The graph below gives us a snap shot of all home sales separated by type in 2013. In December there were 2 bank owned sales, along with the one short sale we previously discussed. That number only varied slightly through the year in comparison to the traditional home sale number. In December, 93% of sales were traditional, 2% were short sales, and 5% were bank owned.

Eagle Home Sales_Type '13

Disclaimer

Eagle Idaho Short Sales & Foreclosures | 2013

Eagle, Idaho has had a consistently low foreclosure rate this year in comparison to 2012. In November, 6.1% of real estate sales were foreclosures in comparison to 9.7% in November of 2012. As you can see in the graph below, the foreclosure rate started to drop significantly after January of last year. Last January there was a 46.4% foreclosure rate, and  it started to drop dramatically until July when it hit 8.8%. This year in general the foreclosure rate has been down by about 55% on average in comparison to 2012. Between May and November of this year the foreclosure rate has only varied slightly in percentage changes through the months, varying between 5.2% and 6.3%.

Foreclosure Rate Eagle '13 vs. '12

As you can see in the graph below in comparison to traditional home sales in Eagle, short sales and bank owned properties are very low. For example, in July of this year, there were 68 traditional real estate sales and only 2 short sales and zero bank owned/ HUD property sales. Not only were there zero bank-owned properties in July, but there has only been 1 sold since. Short sales have also been historically low this year, with only 28 sold for the entire year. When combining the short sales with bank-owned/ HUD, only 9.9% of real estate sales have been foreclosures this year. Traditional home sales are higher this year than they were in 2012. In November 46 non-foreclosures sold in comparison to 28 in 2013. These are all factors to a market that’s re-gained its health in 2013.

2013 Eagle RE Sales by Type

Disclaimer

Eagle ID Short Sales Stats | November 2012

Eagle ID short sales hit their lowest point this year during the month of November.  In fact, there was only one.  Still, monthly short sales in Eagle ID have typically ranged between 3 and 7 this year.  There’s also been a drop in short sales from one year ago.  And, while the chart below shows that a few months in 2012 actually posted higher numbers, the overall average for Eagle ID short sales per month this year has been 4.6.  In 2011 there was an average of 6.8 short sales each month (Dec. ’11 numbers included.)

Eagle ID Short Sales 2011 vs. 2012

While the foreclosure rate remained low in November (9.7%), Eagle ID short sales have been the more dominant type of distressed sale this year.  In the past 11 months, there have only been 25 Eagle bank-owned homes sold.  Short sales more than double that number this year.  Still, when comparing foreclosure rates year-over-year, the numbers are drastically different.  Last year, the foreclosure market share for November was 46.2%, making it 36.5% higher than Nov. 2012 numbers.

Eagle ID Real Estate Sales by Type 2012 Market Stats

While the numbers are negligible, most of the Eagle ID short sales this year were in the Brookwood subdivision.  There has been a total of 7.  Banbury Meadows, which has the second highest amount, has posted 5 short sales.  The short sale in Eagle ID from November was in the Lexington subdivision.  Lexington subdivision has now had 4 this year, making it the third highest total for short sales in a given subdivision.

Disclaimer

Eagle Idaho Short Sales | Jan.-June 2012

The number of Eagle Idaho short sales stayed fairly consistent through the first half of 2012, generally averaging around 5-6 short sales per month, with a few fluctuations.  This is much lower than the average number of short sales in Eagle ID during the same time period in 2010 and 2011.

Eagle Sales Yr over YR_2012


During this same time period the number of bank-owned and HUD properties sold each month have been decreasing while, at the same time, total sales have been increasing.  As depicted below, Eagle Idaho short sales in June were 28.5% lower than January, and bank-owned and HUD properties sold in June were 66.7% lower.  However, total sales were 133% higher in June over January.

Eagle Home Sales by Type_June 2012


The result?  The Eagle Idaho foreclosure market share is at its lowest point in years.  At its highest point, the market share for foreclosures (Eagle Idaho bank-owned or REO) and pre-foreclosures (Eagle Idaho short sales) was 75% in January 2010. January 2011 saw a foreclosure rate of 70.6%; the foreclosure rate in January 2012 was 46.4%.  Since then, the foreclosure rate for 2012 has steadily declined to a low of 16.7% in June.

Eagle Foreclosure Rate June 2012


disclaimer

Eagle Idaho Short Sales | Market Stats | Q2 ’10

Eagle Idaho short sales continue to be a major influence in the Eagle real estate market.  Currently, 30% of the homes for sale are short sales and in June, accounted for 26% of the sales.

When combining the short sales and bank-owned properties, the Eagle foreclosures accounted for 55.9% of the sales in June.  This is about level with previous 3 months as you can see below.

Below you can see the distribution of the Eagle Idaho short sales, bank-owned, and non-foreclosure over the last three months.

The next two graphs look at Ada County to see which areas have the highest percentage of short sale and bank-owned properties for sale.  As you can see, 30% of the Eagle homes for sale are short sales which is about average with the county.  For bank-owned homes, Eagle has one of the smallest percentages with only 7% market share.

Eagle Idaho Short Sale Market | Dec. ’09

There were 5 Eagle short sales that closed in December.  That’s equal to the number closed last month and down from the monthly high of May when 17 were closed.  Overall home sales were up 36.9% compared to December of ’08 with 37% of the sales being foreclosures (bank-owned or short sale).  The median home price was $354,900, up from $254,750 a year ago.

Data Source: Intermountain MLS for Single Family Homes.  Information not guaranteed.

Eagle ID Short Sales | September 2009

In the Eagle real estate market, there were 38 total sales during the month of September.  Of those, 10 of them were Eagle bank-owned and 9 were Eagle ID short sales.  This makes Eagle ID short sales about 24% of the total real estate market.  The graph below shows the distribution of non-distressed, bank-owned, and Eagle short sales for the past five months:

Eagle sales breakdown

Eagle bank-owned and Eagle ID short sales combined made up half of the Eagle real estate market.  This percentage can fluctuate from month to month but September’s number seems to be a reasonable average of the last five months.

Eagle home foreclosures

The median price of sold Eagle short sales dropped in September, but the median price of total homes sold in Eagle stayed pretty close to the level it was at last month.  The graph below breaks down median prices in Eagle for the last six months:

Eagle median prices

Data source: Boise MLS (IMLS).  Information not guaranteed.

Eagle Idaho Short Sale Stats | Aug ’09

In the Eagle Idaho real estate market, 40 homes sold during the month of August; the graph below shows that 19 of those were non-distressed, 10 were Eagle bank owned, and 11 were Eagle Idaho short sales. In August, Eagle Idaho short sales made up 28% of the total homes sold in that area.

August Eagle Home Sales

With the exception of July, short sales over the last six months have had a higher median sold price than the overall median price in Eagle Idaho. The 6 month median price for Eagle Idaho short sales was $407,000 while the overall was of $326,000. See graph below.

Median Home Prices in Eagle

In August, 53% of homes sold in the Eagle real estate market were foreclosures (Eagle bank-owned & Eagle short sales), making Eagle Idaho foreclosures the highest percentage in Ada County. That also more than doubles the lowest foreclosure rate in Kuna at 24%

August Foreclosures

Information deemed reliable but not guaranteed.

Eagle Idaho Short Sales

Currently 21% of the homes for sale in Eagle Idaho are being offered as a “possible Eagle short sale.”   Below is a breakdown of the Eagle Idaho short sales by price class.  The largest market share of homes are made up homes between $100,000 and $200,000.

Eagle Idaho Short Sales Total For Sale Short Sales Percentage
Under $100,000 0 0 n/a
$100,000 to $200,000 30 9 30%
$200,000 to $300,000 88 21 24%
$300,000 to $400,000 99 22 22%
$400,000 to $500,000 68 15 22%
Over $500,000 163 29 18%

Browse the Eagle Idaho short sales now for free and without registration.

Data Source: IMLS.  Information not guaranteed.